Indexing Apache access logs with ELK (Elasticsearch+Logstash+Kibana)
Who said that grepping Apache logs has to be boring?
The truth is that, as Enteprise applications move to the browser too, Apache access logs are a gold mine, it does not matter what your role is: developer, support or sysadmin.
 |
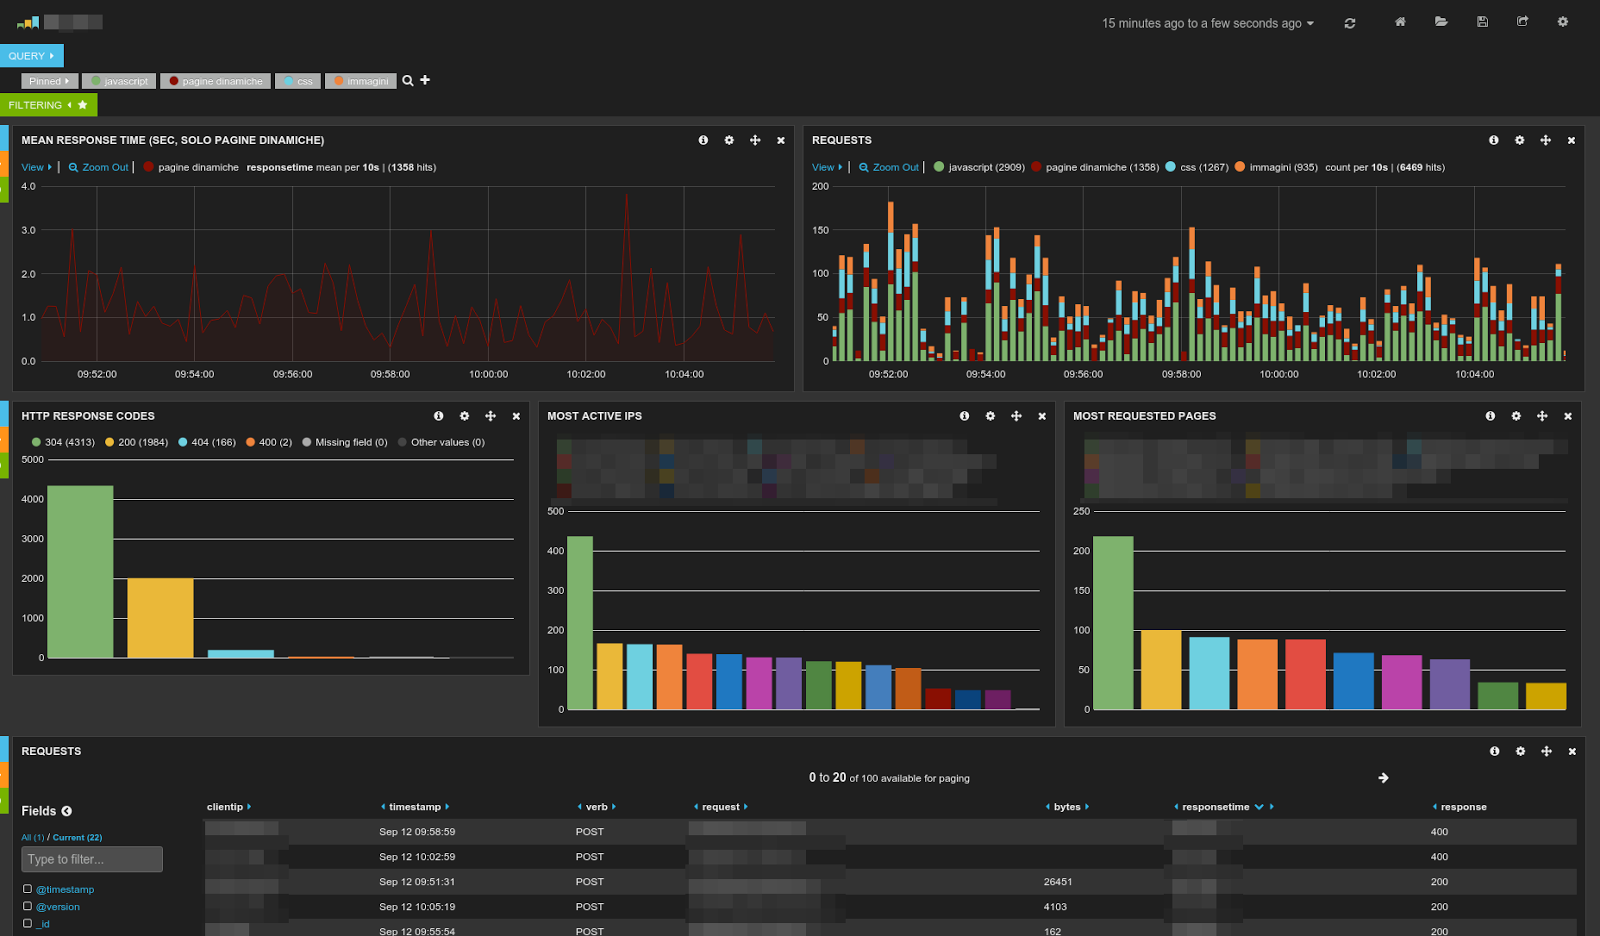
| Sample of dashboard that can be created with ELK. Pretty impressive, huh? |
If you are not mining them you are most likely missing out a ton of information and, probably, making the wrong decisions.
ELK (Elasticsearch, Logstash, Kibana) is a terrific, Open Source stack for visually analyzing Apache (or nginx) logs (but also any other timestamped data).
Provided you have Java installed, its setup is rather easy, so I am not going too much into the details. I will instead focus on a couple of points that are not easily found documented online.
My setup is as follows: the Apache host which serves a moderately used Intranet application sends the access_log to another host for near-line processing via syslog.
Relaying access_log through syslog is activated as follows in httpd.conf:
LogFormat "%h %l %u \"%r\" %>s %b \"%{Referer}i\" \"%{User-Agent}i\" %D" extendedcombined
CustomLog "| /bin/logger -t httpd -p local0.notice" extendedcombined
This extendedcombined format is basically the standard combined format plus %D or the time taken to serve the request (in microseconds, reference here). We will use this field (which I will refer to as responsetime from now on) to plot a nice histogram in Kibana.
I will leave configuring syslog, syslog-ng or rsylog out and skip ahead to the point where logs are now stored in another server in a custom directory, say /var/log/access_logs.
This server will host the complete ELK stack and we will use Logstash to read, parse and feed the logs to Elasticsearch and Kibana (a single page web app) for browsing them.
Also you probably don't want certain fields like request to be analyzed (broken into tokens and then indexed) at all.
The following mapping fixes all that can be used with the log format described in this post or can be quickly adapted. Even if you don't end up using all the fields defined in the template, Elasticsearch is not going to complain.
This server will host the complete ELK stack and we will use Logstash to read, parse and feed the logs to Elasticsearch and Kibana (a single page web app) for browsing them.
Raise file descriptor limits for Elasticsearch
Elastisearch uses a lot of file descriptors and will quickly run out of them, unless the default limit is raised or removed.
Adding:
Adding:
ulimit -n 65536to the ES startup script will raise the limit to a value that should be very hard to reach.
Configure logstash grok pattern
The following is a grok pattern for the log format above:
EXTENDEDAPACHELOG %{SYSLOGTIMESTAMP:timestamp} %{GREEDYDATA:source} %{IPORHOST:clientip} %{USER:ident} %{USER:auth} "(?:%{WORD:verb} %{NOTSPACE:request}(?: HTTP/%{NUMBER:httpversion})?|%{DATA:rawrequest})" %{NUMBER:response} (?:%{NUMBER:bytes}|-) "%{GREEDYDATA:referer}" "%{GREEDYDATA:agent}" %{NUMBER:responsetime}
Admittedly getting the grok pattern right is the hardest part of the job. The grok debugger app is an indispensable tool if you need to figure out a custom pattern.
Configure Elastisearch template
Without a properly configured mapping template ES will not index the data fed by logstash in any useful way, especially if you plan on using the histogram panel to plot responsetime values or sort the table panel by bytes or responsetime (hint: those two fields must be stored as a number in ES).Also you probably don't want certain fields like request to be analyzed (broken into tokens and then indexed) at all.
The following mapping fixes all that can be used with the log format described in this post or can be quickly adapted. Even if you don't end up using all the fields defined in the template, Elasticsearch is not going to complain.